
Picture this: You’ve kick-started your digital feedback strategy, put your first forms live, and data is starting to pour in. Great! But now what? How do you turn that raw data into actionable insights that will positively impact your business? This was the topic for our last webinar, ‘5 ways to turn feedback data into CX gold’. Did you miss it? Don’t sweat it! We’ve summarised the most important parts for you in this blog.
Collecting feedback from digital channels like websites, mobile apps and email campaigns is standard practice nowadays. After all, 78% of customers state that they prefer brands that ask for customer feedback.
In spite of this fact, many organisations still struggle with converting their data into concrete action points. That’s why our Digital product Manager, Jos van der Kooij, and Customer Success Manager, Amélie Bouchenot, broke down five concrete ways to make sense of your data.
In this blog, we’ll cover these steps:
- 1. Goal & form setup
- 2. Democratising feedback
- 3. Tips for analysing your data
- 4. Make your life easier with smart insights
- 5. Close the loop
So without further ado, here we go:

Want to watch '5 Ways to Turn Feedback Data into CX Gold'?
Check out the full recording at your own pace, and share the knowledge with your colleagues!
1. Goal & form setup
To get the most out of your feedback, it’s important to get the foundations right. Without looking into what your end goals are and how to best reach them, it will be difficult to draw any meaningful insights from your data.
To get the best start possible, Amélie and Jos recommend to:
- Define your goals
- Build the right feedback forms
- Set the right timing
Step 1: Defining your goals
This part lays the entire foundation for how to conduct your feedback strategy. Based on your goals, you can decide:
- What to ask in your forms
- What kind of feedback form you should use (i.e. pop-up, embedded, slide-in, etc.)
- In which channels you should publish your feedback forms (i.e. website, mobile apps, email campaigns)
- When to trigger your feedback forms
Defining your goals also makes the analysis parts easier, as it allows you to pick metrics and set standards for how to read your results beforehand.
So to summarise, start by mapping out:
- What do you want to find out?
- How are you going to measure it?
Step 2: Build the right feedback forms
Based on your goals, you can move on to building your feedback form. Start by choosing what kind of questions you want to include.
Common feedback metrics that use somewhat formulaic questions are:
- Customer Satisfaction (CSAT) Score
Example: How satisfied are you with your experience on our website today? - Net Promoter Score (NPS)
Example: On a scale of 0-10, how likely are you to recommend or product/service to friends and family? - Goal Completion Rate (GCR)
Example: Did you find what you were looking for on our app today? - Customer Effort Score (CES)
Example: How difficult was it for you to complete your purchase today?
There are, of course, a myriad of different questions and metrics. One thing to always keep in mind, however, is to keep your forms short and concise. Also, ensure that you are only researching one thing per survey, so as not to confuse your visitors.
Are you looking for inspiration? Check out our blog on survey questions: complete with 80 examples to get your creative juices flowing!
Step 3: Set the right timing
When and where you display your feedback forms are just as important as what you ask in them. Depending on your goals, you can trigger forms based on user behaviour, like exit intent or time spent on a specific page.
You can also choose to have your form available at all times via a feedback button to collect more general feedback.
Optimising the targeting of your users improves the amount of relevant answers and prevents survey fatigue. In other words, make sure to show your feedback forms when it’s relevant in the customer journey for your users.

2. Democratising feedback
Making feedback data accessible throughout your entire organisation creates a more engaged, innovative environment with the customer experience at the centre.
Most teams can benefit from customer insights, from product to marketing and customer service. To get the most out of your feedback data, it’s important that the right insights reach the right department.
But how do you make it happen? Jos explains how setting up the feedback strategy with democratisation in mind from the start helps the process.
These are his tips for a smoother information flow:
- Build the team: Decide project owners, set responsibilities and decide which teams should be involved.
- Set rules: Who and which team should receive what kind of feedback, and when should they receive it?
- Feedback sessions: Plan regular meetings and check-ins to discuss the feedback you have received. Decide which actions you are going to take based on the insights you have received.
- Follow up: Follow up on the actions that are being taken and check in to see what is in progress.
- Close the loop: Once the project has reached its end, it’s important to close the loop. Create updates on improvements in the customer experience, take accountability and evaluate your process.
How does Mopinion’s customers democratise feedback?
To illustrate how this could work in practice, Amélie gave an example of how one of Mopinion’s customers within the business-to-consumer (B2C) sector operates in order to democratise their feedback:
Daily standups
During these daily standups, the team talks about yesterday’s results, action points as well as what’s coming next.
Weekly reflections
The weekly reflections are for discussing what has been fixed during the entire week, what new issues might’ve come up and what the priorities for the upcoming week are.
Monthly insights
This is when insights and results get shared with management, giving them a clear overview of the bigger picture.
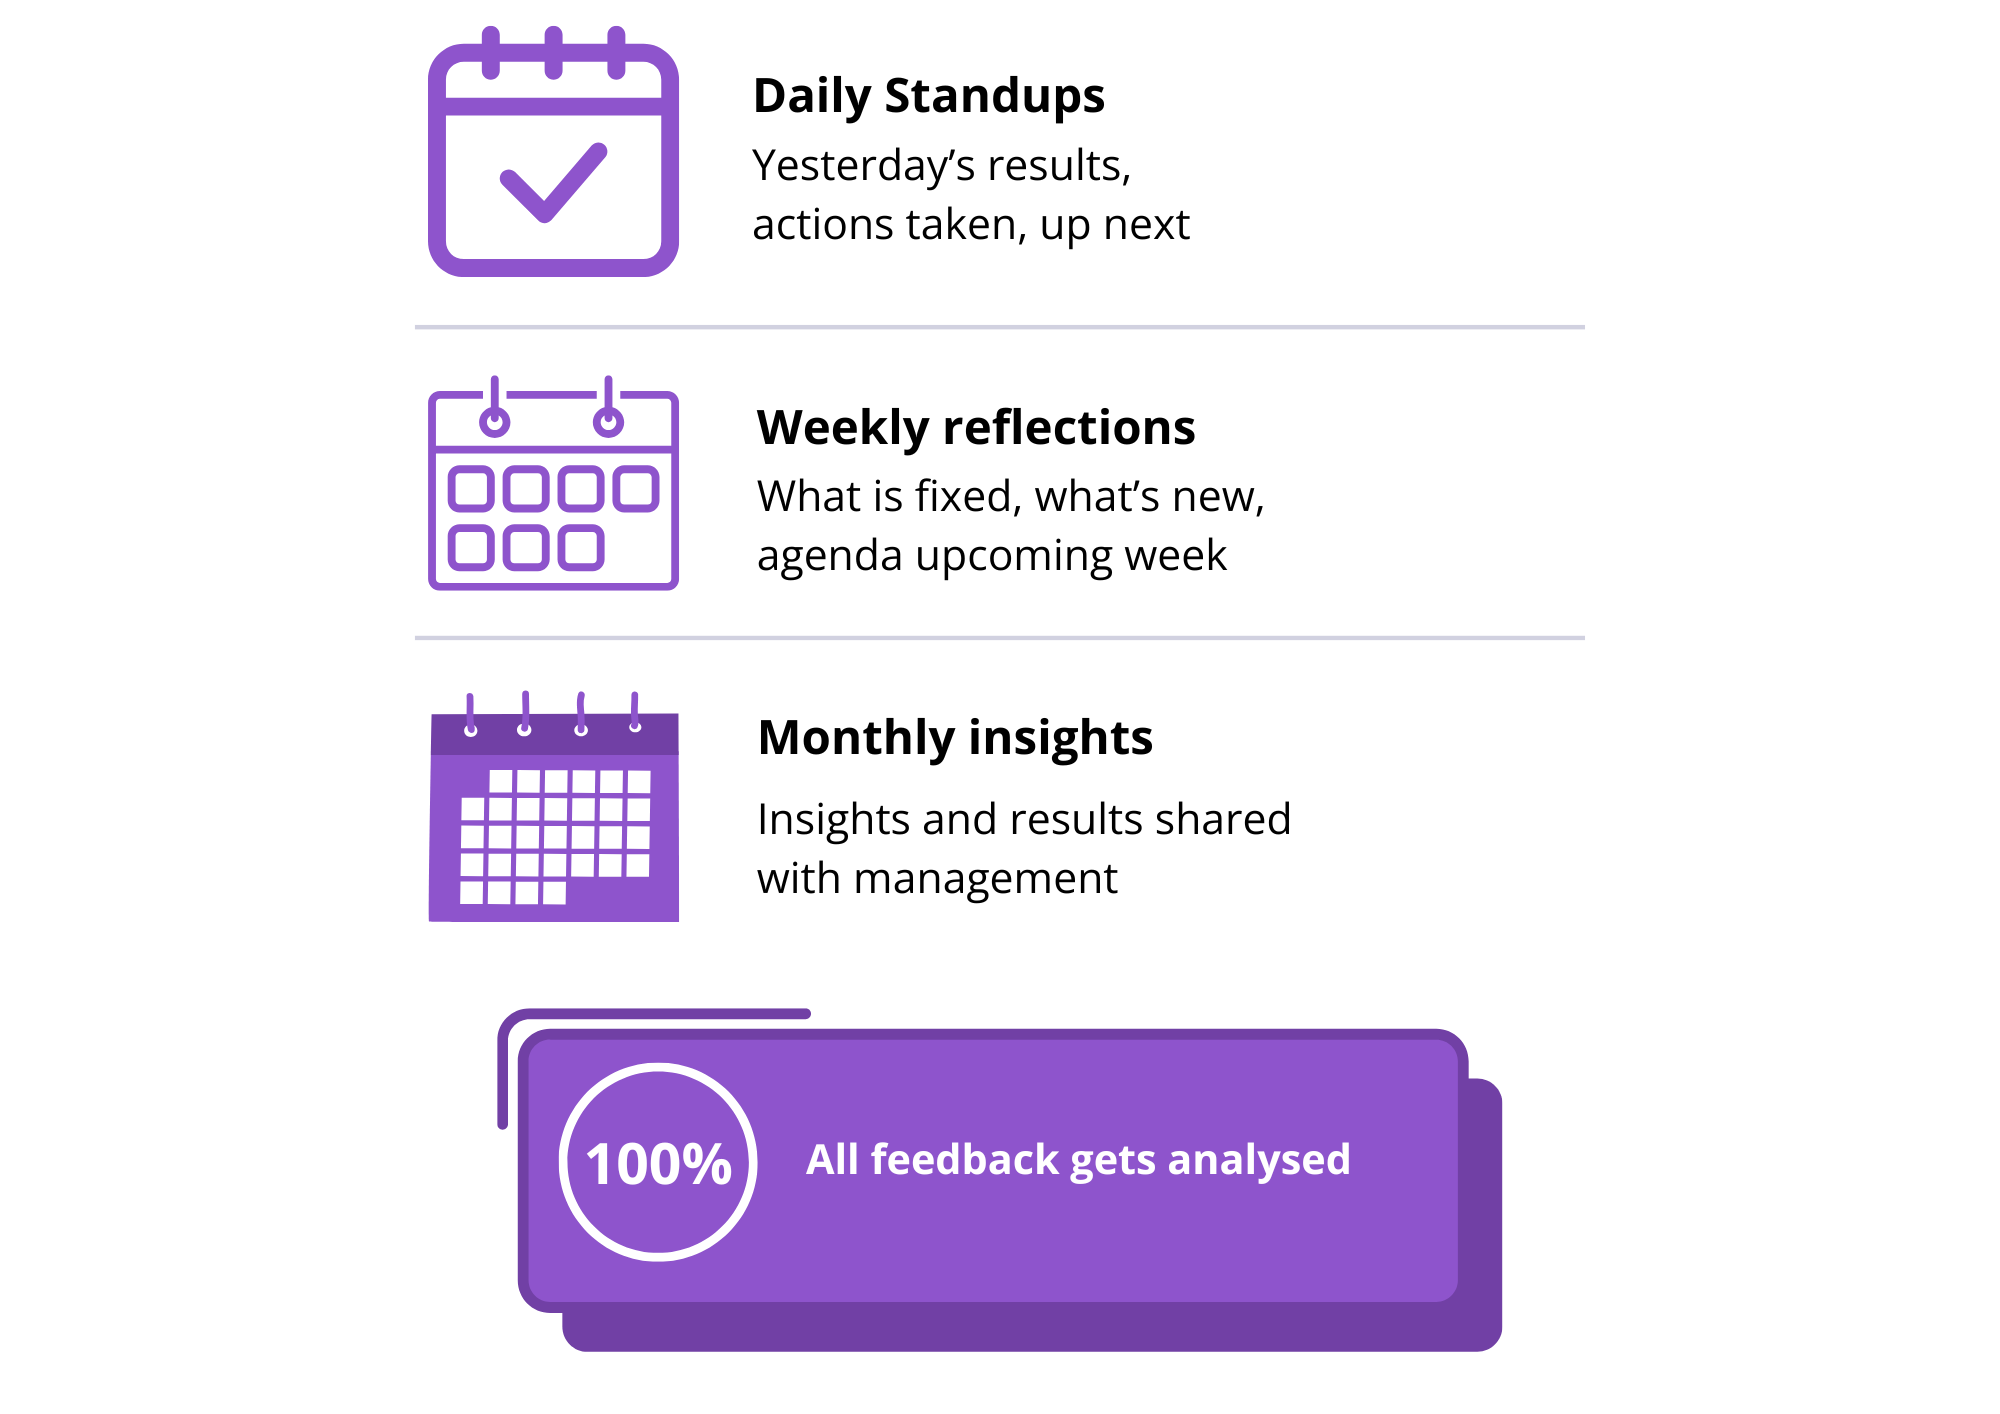
By working in this manner, the company ensures that all feedback is analysed and, most importantly, implemented in the right way by the right team.
3. Tips for analysing your data
Analysing your data can be easier said than done if you don’t know in which end to start. That’s why Amélie and Jos have put together three concrete tips for how to get your feedback analysis started on the right foot.
Let’s dive in.
Setting tagging and filter rules
Amélies first tip for analysing your data is to set tags and filter rules. When you collect a large amount of qualitative data, it can be hard to get a clear overview.
Tagging and filter rules help you identify trends, pinpoint pain areas and better understand customer sentiment. Tagging can, for example, be done by:
- topic (like checkout or login)
- responsible team
- a certain product section
- a specific journey step
Setting tags works differently depending on what feedback software you are using, but with Mopinion, you can mass-tag your incoming feedback.
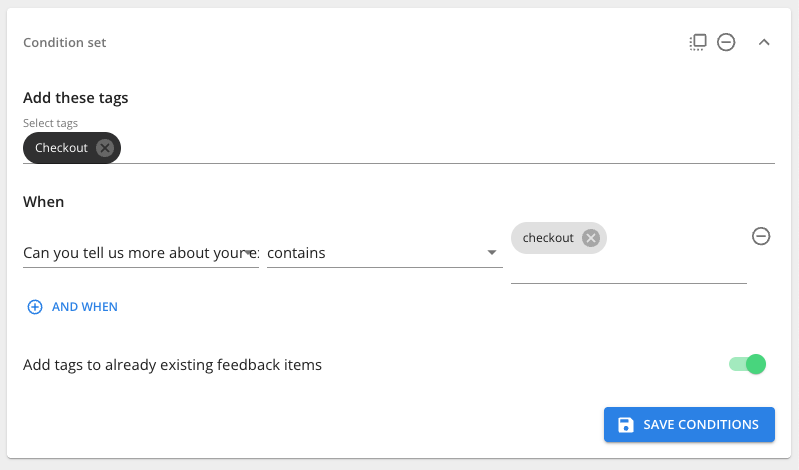
Let’s say that you are researching feedback regarding your checkout. Then you can simply apply a tag with the topic ‘checkout’ to all your open feedback comments that contain the word ‘checkout’. After that, it’s easy to filter and get a good overview of all incoming feedback, based on your set tags!
Create easy-to-use dashboards
Making dashboards easy to read and use for everyone involved in your feedback project is crucial for your success. By doing so, it doesn’t matter how data literate your team is; they can still find crucial information and insights from your feedback.
These are some good rules of thumb to keep in mind when creating dashboards:
- Decide what information you need and why
- Only include vital numbers/scores – too much fluff will bury the important insights
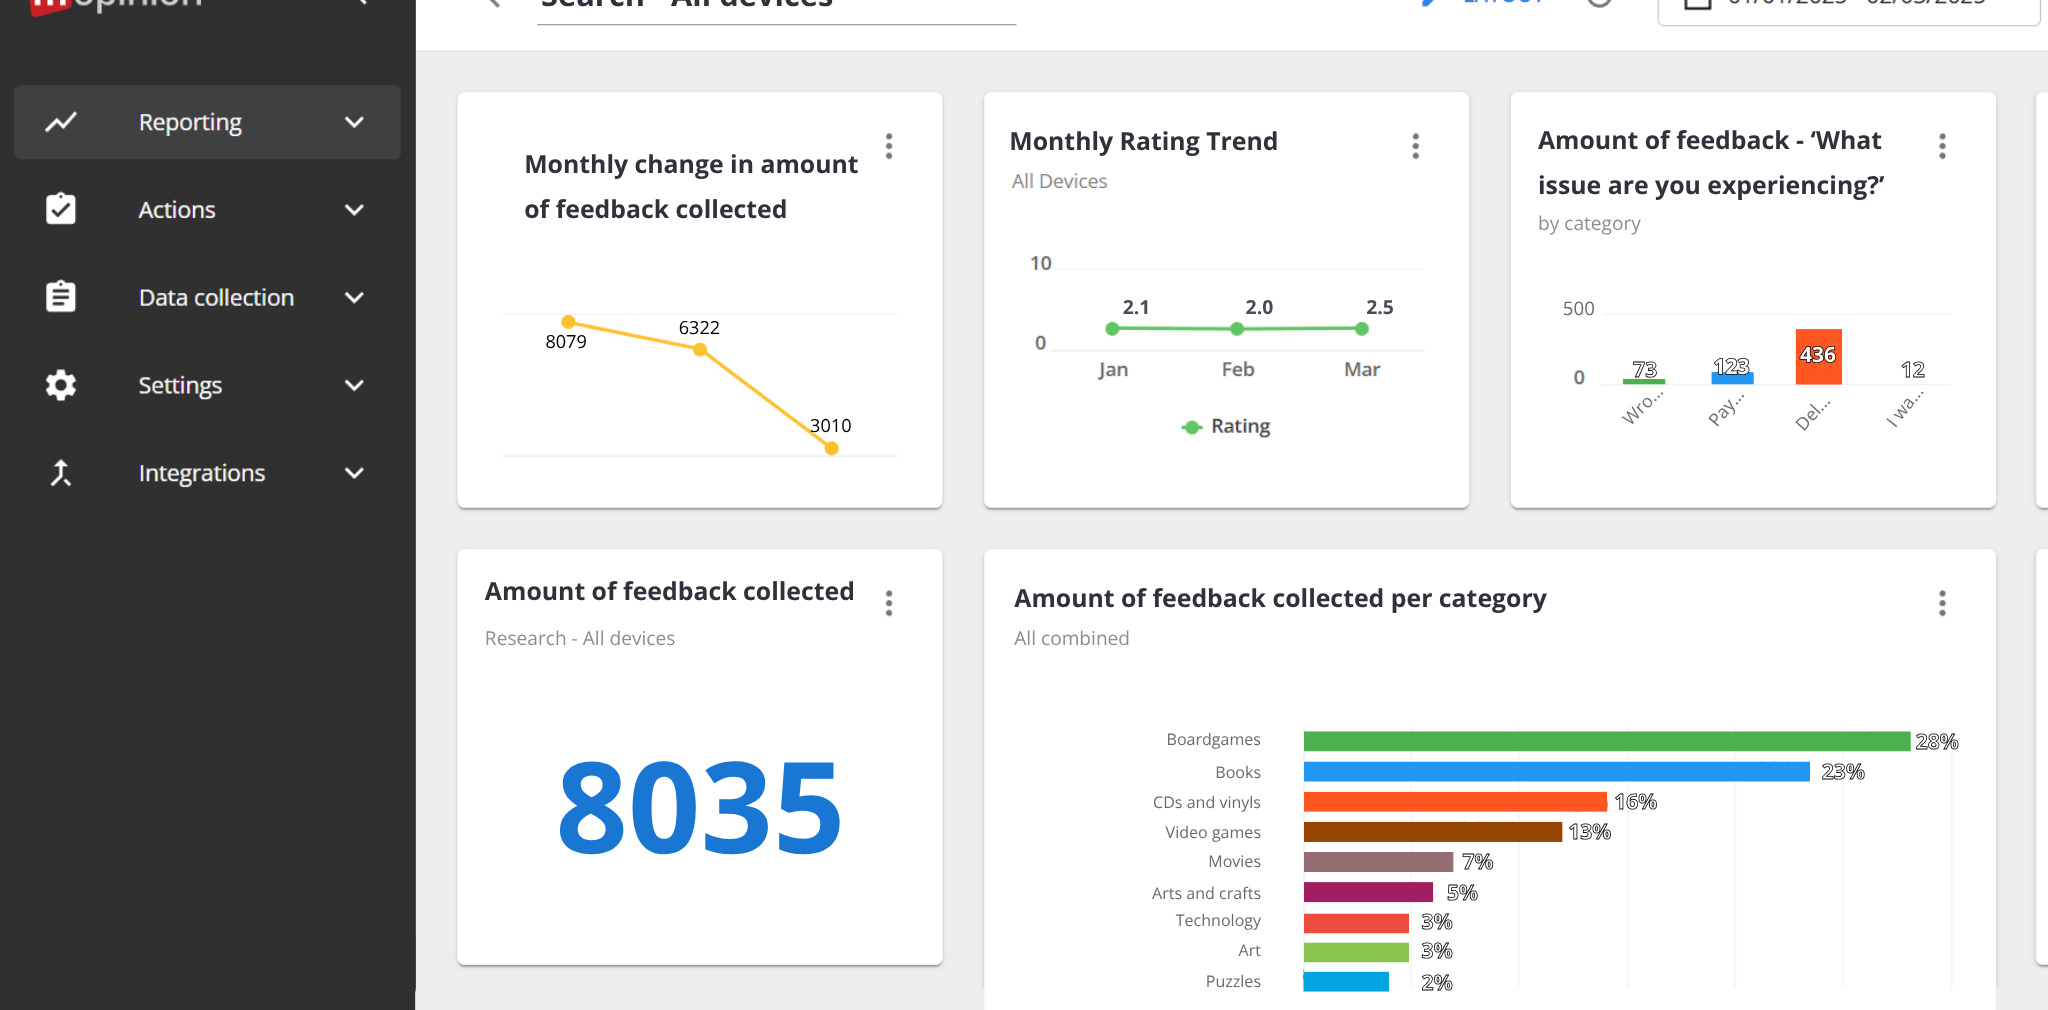
An example of a Mopinion dashboard
By doing this, your dashboards will be easy to read for everyone in your team and include the vital information you need.
Set up alerting systems
Ensuring data and feedback are shared on channels where your team is daily makes it more likely that the correct insights reach the right people and that action points are set up accordingly.
By using integrations in project management and communication tools like Slack, Google Chat, Jira and Microsoft Teams, you can:
- Ensure that your data is democratised
- Reach the right team – I.e. that customer service questions go to the customer service team
These alerts can, of course, also be sent via email. It really depends on your team’s way of working.
4. Make your life easier with smart insights
When done right, automation in digital feedback analysis can significantly speed up the entire process. Most notably, the right automation and/or AI solutions can:
- Eliminate human error
- Prevent biases – it’s so easy to subconsciously try to prove your theories, overlooking what might be more pressing issues
- Save time by eliminating manual work
- Ensure that your data is democratised
So, what are some examples of ways to automate your analysis?
Scheduled reporting – Analytics delivered to your email
By having your most important data delivered on a schedule to your email, you ensure that you never miss important insights.
Additionally, having reports sent via email makes sharing your findings and data a lot easier – essentially making democratisation a walk in the park, which ultimately fosters a healthy cross-department collaboration.
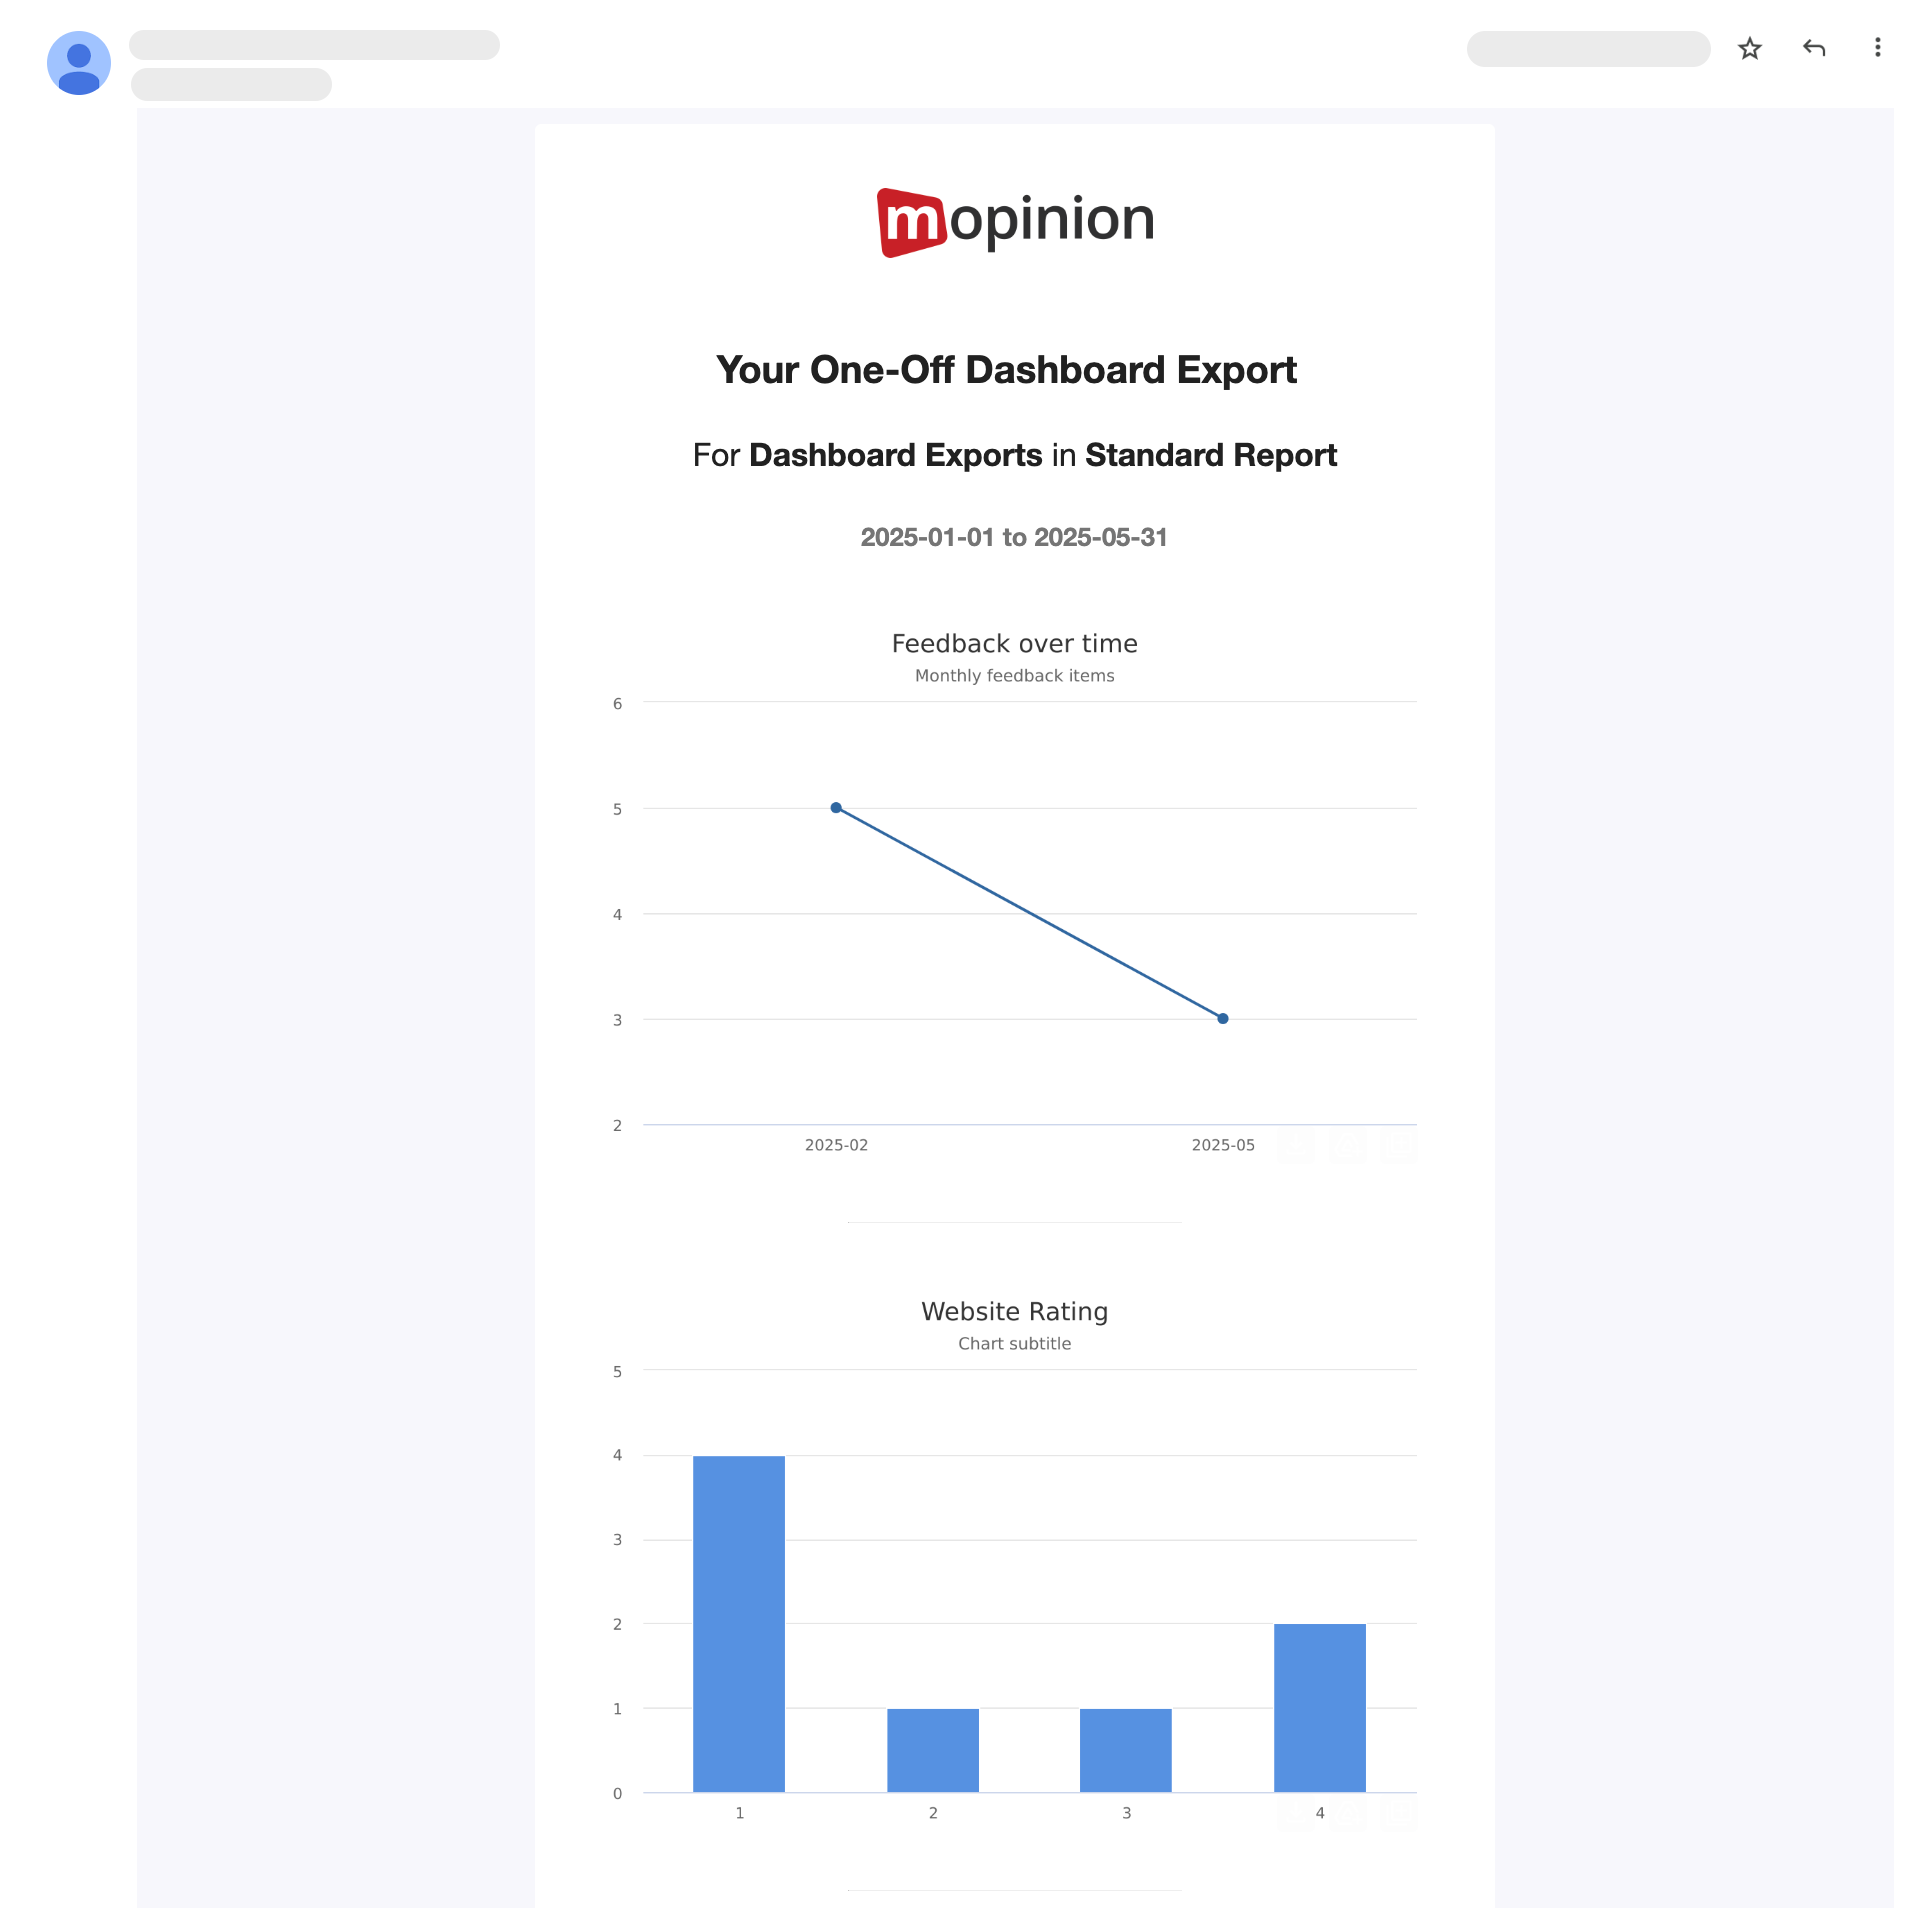
At Mopinion, this can be done with our solution Dashboard Exports. It allows you to choose between receiving an export once or setting up a daily, weekly or monthly schedule to receive your favourite charts from your custom Mopinion dashboards.
Automated dashboarding
Automating your dashboards makes it easier to showcase your most important data. Not to mention – it saves a lot of time not having to set up dashboards from scratch.
Using automatically generated dashboarding also helps with accessibility and democratisation, as it’s not necessary to have prior knowledge of analytics software to dig into the numbers and data. Everyone in your team can simply fire up the dashboard to find the numbers they are looking for.
Mopinion’s version of automated dashboards is called Direct Insights. It allows you to focus on collecting feedback and implementing the insights you gather, while the software automatically sets up dashboards with your most important numbers and figures.
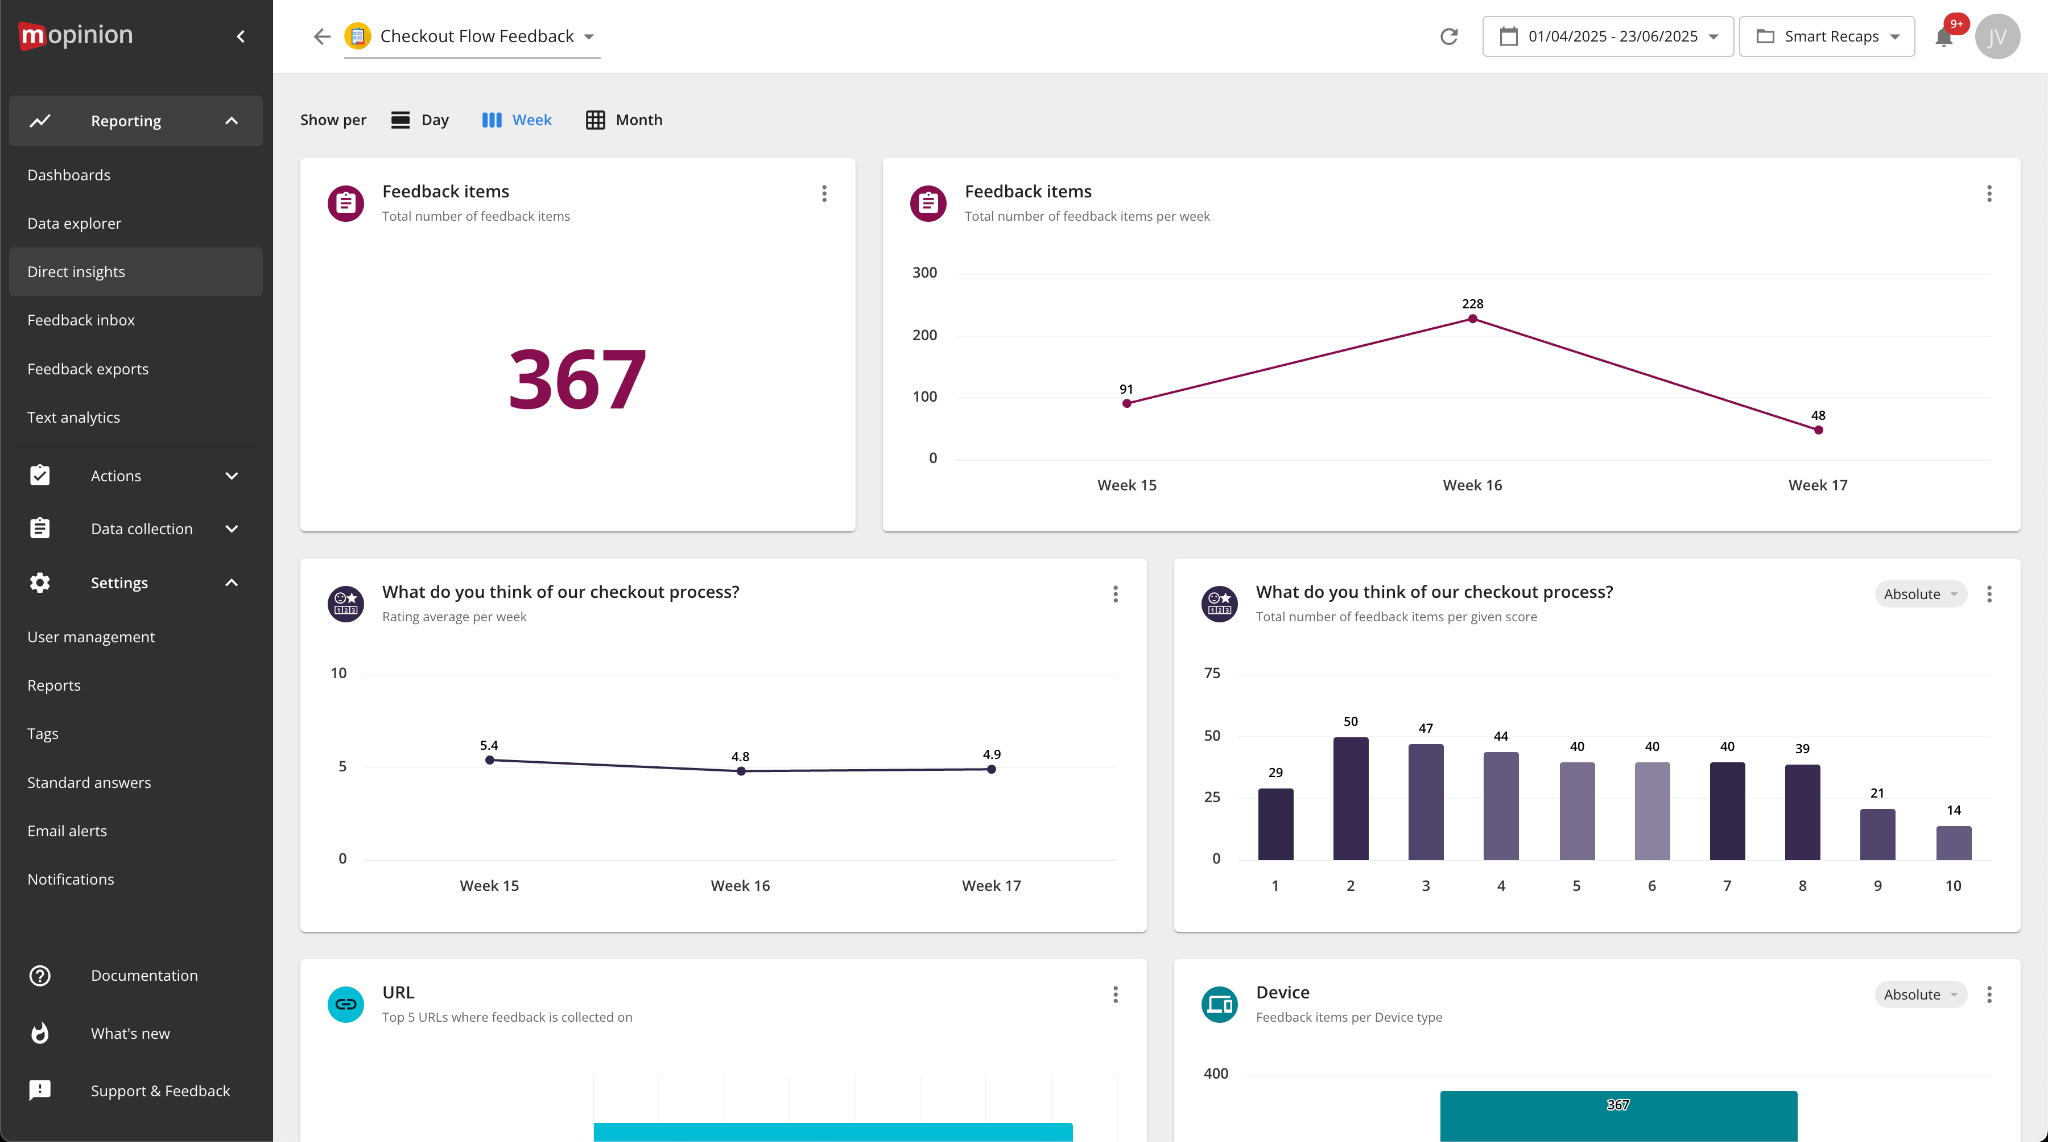
An example of a dashboard generated by Direct Insights
The power of AI – Feedback summarisation
If you collect a lot of qualitative feedback, like open comments, reviews and the like, you’re aware that sifting through all this data manually can be quite time-consuming.
As previously mentioned, another issue that easily comes along with analysing any kind of data is that biases quickly sneak in. It’s hard not to look for patterns that confirm already existing theories you might have.
Using AI and automation for customer feedback summarisation removes human error and ultimately delivers more accurate results in a more timely manner, allowing you to focus on implementing beneficial changes for your company. Changes that will lead to a better customer experience, higher conversion rates, more loyal users and overall business growth.

Mopinion’s Smart Recaps
With Mopinion, feedback summarisation is offered via Smart Recaps. This is an AI-powered solution that:
- Summarises your feedback
- Sorts it into topics
- Gives you the rate of sentiment of the feedback you have received; i.e. how much was positive, neutral or negative
This allows you to easily see what topics are most discussed, what might need urgent attention and reduce the time between collecting feedback and closing the loop.
5. Close the loop
We’ve reached the last point of this presentation, but it’s by no means the least important one. Closing the loop means tying up the knot and evaluating your project.
In the webinar, Amélie emphasises:
- Planning in follow-ups: Check in with your project owners and discuss follow-up points, implementations and learnings from the feedback you’ve received.
- Track your work: Project tools like Asana, Basecamp and Jira help keep the accountability within the team, structure your work and see how the data is implemented and processed across teams.
- Shine a light: Ensure that the changes you’ve made based on the collected feedback are highlighted both internally and externally – showing customers that you listen to them is a great way of improving customer satisfaction in the long run.
That was it! We hope you’ve come away with some new inspiration and ideas for your next feedback project. If you wish to watch the webinar back in its entirety, you can find it here: 5 Ways to Turn Feedback Data into CX Gold.
Get the most out of your feedback with Mopinion
Mopinion is the #1 European feedback software for web, mobile app and email.
Turn your feedback into CX gold through highly customisable forms, advanced targeting options, easy-to-use analysis and much more. The latter includes automated dashboards, AI solutions such as text sentiment analysis and Smart Recaps – our AI-powered open feedback summaries – as well as quick, easy data export options.
Ready to see Mopinion in action?
Want to learn more about Mopinion’s all-in-1 user feedback platform? Don’t be shy and take our software for a spin! Do you prefer it a bit more personal? Just book a demo. One of our feedback pro’s will guide you through the software and answer any questions you may have.