Mopinion’s new data loader feature will enable users to import their own feedback data sets and easily visualise and analyse this data from external sources in our dashboards.
There are now several different ways to collect data in Mopinion’s online feedback analytics software. One of the most common is requesting digital feedback via online feedback forms. Secondly, external feedback tools that are connected via APIs can be used to load in your feedback from collection tools you already have in place. And there is also a third option. Mopinion now provides the option to set up automatic imports (for example, by email or sFTP) as well as with manual imports using a data loader, which is our newest, available feature.
How does the data loader feature work?
You can drag and drop your feedback data set (in CSV or Excel format) directly into our file field and upload it directly. The software will then identify the field type for each column based on nature of the data. So for example, if your first column is a date format (1-1-2017), our software will recognise this as a date and label it as such in our platform. The same goes for open comments and feedback scores such as Csat and NPS. Once these variables are all matched up, you can import the data and create your own charts and dashboards. Here are some tips on how to build these dashboards.

The advantages
There are many feedback collection tools out there and many companies that use multiple tools at once but do not have a way of comparing and visualising these feedback items in one platform. There are also companies that solely want to visualise and work with research data. Mopinion’s new data loader feature accommodates these needs, while also bringing several additional data features to the table:
- You are not confined to a pre-defined template: You can use your own variables as labels which will be recognised by our system.
- You can add more data to pre-existing datasets: For example, if you have a periodically recurring data export, you can update your report with daily, weekly, or monthly datasets. Additionally, Mopinion’s software builds up an import archive with all previous datasets you’ve imported. This essentially data history where you can see which files you have uploaded, how many records it contained and when this was done. These can be removed when no longer needed.
- It’s not longer necessary to calculate metrics yourself, such as Net Promoter Score (NPS), Goal Completion Rate (GCR) and Customer Effort Score (CES), . Mopinion’s software has built-in capabilities enabling it to calculate these for you automatically.
Accommodating numerous data variables
Mopinion’s feedback analytics software can calculate various metrics used regularly by online marketers and analysts, including (but not limited to) the following:
1. NPS
The Net Promoter Score is a metric used to measure customer loyalty. NPS is broken down into three different groups: Promoters, Passives and Detractors.
Promoters: These are customers who are loyal to your company and will continue to buy from you and refer you to friends and family. Promoters are ranked between 9 and 10.
Passives: Customers who are generally satisfied but not necessarily as enthusiastic as your Promoters. These customers are also more likely to take interest in the offerings of your competitors. Passives are ranked between 7 and 8.
Detractors: That leaves the detractors, which are customers who are discontent with your service or product. And in the event that this feeling of content is spread by the detractor, it can be very harmful to your brand. According to a survey conducted by Unitiv, 75% of respondents indicated that they would be likely to share a bad or negative experience with friends and family, while only 42% would recommend a product/service that they were really happy with. All the more reason to respond to feedback and keep your customers happy, right? Detractors are ranked between 0 and 6.
Calculating NPS:
Take the percentage of Promoters (9 and 10) and subtract the percentage Detractors (0 to 6).
Reporting: NPS can be reported as a single score over a period of time (for example, the NPS of the month december was 22). It can also be calculated in a trend to show how it evolves over time (days, weeks, months) and lastly, we can show the distribution (percentage of promoters/detractors/passives) in total or progressing over time.
2. GCR
Goal Completion Rate measures the number of people who complete a specific (marketing) goal on your website or mobile app. It is typically used to see how your website appeals to your visitors and customers. These scores are a key part of your purchase funnel as you can often shows conversion rates ranging from the awareness to purchasing phase. Operationally you ask your visitors: “Were you able to reach your goal (with this visit to our website)?” Then you offer three options, ‘Yes’, ‘Partially’ and ‘No’.

Calculating GCR: Goal Completion Rate = Percentage of Goal Completed (Yes) / Total percentage GCR (Yes, Partially, No)
Reporting: GCR can be reported as a single percentage over a period of time (for example, the GCR of December 40% – meaning 40% said “Yes I’ve reached my goal”). It can also be calculated in a trend to show how it evolves over time (days, weeks, months) and lastly, we can show the distribution (Yes, Partly, No) in total or progressing over time.
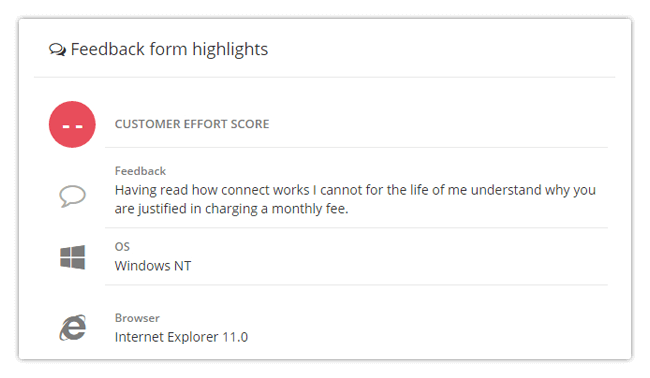
3. CES
Customer Effort Score essentially measures how much effort your customers had to put into achieving their goal on your website or app. Using this metric can enable you remove obstacles in the path of your customers. For example, say you have a customer who ranks their experience as satisfactory but they do not remain loyal to your brand and you have no idea why. This metric gives you insight into what difficulties they ran into along the way whilst trying to achieve their online goal.

Calculating CES: We calculate the percentage of people that give a score of “very little effort” and “little effort”. So basically a 1 or a 2. And then we calculate this as a percentage, so you will get for example 65%. This means that 65% of all people who provided a CES score said it took “very little effort” or “little effort” to achieve their goal.
Reporting: Similar to GCR, CES can also be reported as a single percentage over a period of time. For example, the CES of November is 64%. This represents the percentage of customers who had to put little effort to very little effort into achieving their goal. It can also be calculated in a trend to show how it evolves over time (days, weeks, months) and lastly, we can show the distribution ((Very) little effort, neutral, (very) much effort) in total or progressing over time.
4. Browser type
An additional metric is identifying the type of browser (i.e. Internet Explorer, FireFox, Google Chrome, Safari) your visitors/customers are using. You can probably already guess why this is an important metric in the area of website optimisation and identifying bugs and web page errors.
As Foundant Technologies puts it, “Think of the website as the host of a party, they give a party planner (the browser) a list of all the things needed for the party and explains where everything should go. But sometimes a host might say one thing and the party planner understands another. The end result is that, as the guest to the party, you end up confused because you are trying to eat soup with a fork”.
In other words, not all browsers have the same approach in terms of development and there is no single way of displaying information on a web page. Therefore, identifying which browser your visitors are using can be key in identifying a technical error.
Identifying browser type: This can be done using a user agent. Basically, this allows the website to adapt to a particular advice, i.e. browser or operating system.
5. URL
With much of the feedback data you receive through feedback collection, it is often important to identify the particular URL where the feedback originated from or pertains to. Which is why with Mopinion’s software also imports URLs for both your website and mobile app. With this information you can not only identify the origin of feedback, but also see which pages score the highest or lowest, for example.
6. Open Comment
The open comment field is a great way of capturing qualitative data from your online visitors, often rich with sentiment and deeper insights into different parts of your website.

Analysing Open Comments: A number of techniques can be applied to analyse open comments (also known as text analysis), including word count, word grouping, sentiment analysis and categorising comments via machine learning. Read more about text analysis and how to apply these techniques in my previous blog on how to “Reduce churn using text analytics”.
Grab your feedback data and start analysing!
Any digital marketer or analyst knows that these are some of the best metrics out there for analysing online customer feedback. Already collecting feedback and using a lot of these metrics too?
Ready to see Mopinion in action?
Want to learn more about Mopinion’s all-in-1 user feedback platform? Don’t be shy and take our software for a spin! Do you prefer it a bit more personal? Just book a demo. One of our feedback pro’s will guide you through the software and answer any questions you may have.