

Website feedback gives organisations direct insight into what visitors experience, where they encounter friction and what needs to improve. Feedback analytics turns these scores, comments and contextual data into patterns that teams can understand and act on.
Behavioural analytics can show where visitors click, hesitate or leave a website. Website feedback explains why. By connecting scores and comments with information such as page, browser, device or journey stage, teams can move from individual responses to actionable insights.
In this guide, we explain how website feedback analytics works, which methods you can use and how to turn the results into meaningful website improvements.
TL;DR – Article summary
- Website feedback analytics combines visitor scores, comments and contextual data to explain what happens on a website and why.
- It helps teams identify recurring issues, compare website journeys and prioritise improvements.
- Common methods include trend analysis, segmentation, thematic analysis and sentiment analysis.
- AI can summarise, categorise and interpret large volumes of feedback, but human judgement remains essential.
- Feedback analytics creates the most value when insights are assigned, acted on and measured.
In this blog, we’ll cover:
- What is website feedback analytics?
- Why is website feedback analytics important?
- What website feedback data can you analyse?
- How do you analyse website feedback?
- Which feedback analytics methods can you use?
- How do you turn website feedback into action?
- What should website feedback analytics software include?
- Frequently asked questions
What is website feedback analytics?
Website feedback analytics is the process of organising and interpreting feedback collected from website visitors. It helps teams identify patterns, understand the reasons behind visitor behaviour and decide which website improvements to prioritise.
It brings together three types of information:
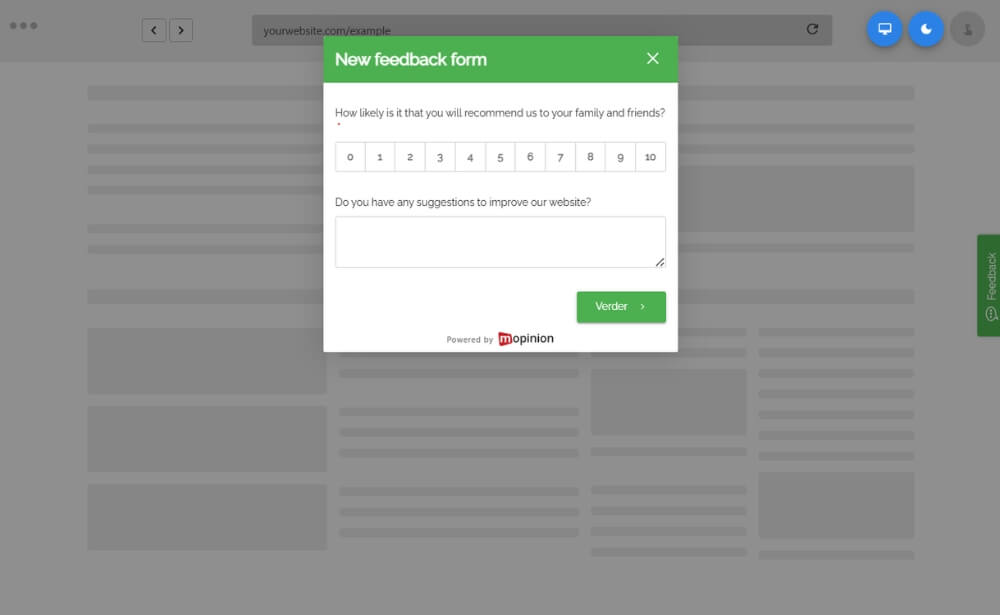
- Quantitative data: Scores and metrics such as Customer Satisfaction Score (CSAT), Net Promoter Score (NPS), Customer Effort Score (CES) and Goal Completion Rate (GCR).
- Qualitative data: Open-text comments explaining what visitors experienced and why they gave a particular score.
- Contextual data: Information such as the page, device, browser, customer segment or journey stage connected to the response.
Quantitative data shows what is happening. Qualitative feedback provides the explanation, while contextual data reveals where and for whom the experience occurred.
This is where website feedback analytics differs from traditional web analytics. According to Nielsen Norman Group’s overview of quantitative user research, analytics data can show where users go, what they click and where they leave a website or digital product. Direct feedback complements this information by helping teams understand the experience behind that behaviour.
For example, web analytics may show that visitors are abandoning the checkout page. Website feedback can reveal whether unexpected delivery costs, a confusing form or a payment error caused them to leave.
Why is website feedback analytics important?
Collecting website feedback is only valuable when your organisation can interpret and act on it. Without analysis, responses can quickly become a collection of scores and comments with no clear priority.
Website feedback analytics helps organisations:
- Identify recurring visitor frustrations
- Understand the reasons behind low satisfaction scores
- Compare experiences across pages, devices and customer segments
- Detect new or growing website issues
- Prioritise improvements according to frequency and impact
- Track satisfaction and customer effort over time
- Measure the effect of website updates
- Support decisions with direct visitor evidence
It also prevents teams from overreacting to individual responses. One strongly worded complaint may deserve attention, but it does not necessarily represent a widespread problem. Analysing website feedback collectively reveals whether an issue is isolated or part of a broader pattern.
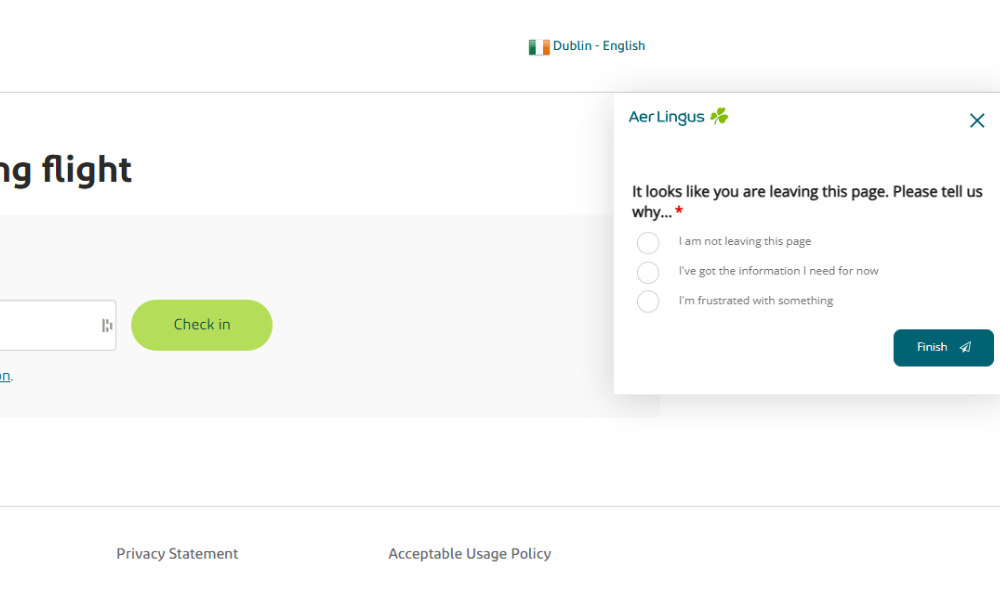
Feedback can be collected through passive feedback buttons, embedded surveys, exit-intent forms and forms triggered during specific website journeys. Our complete guide to website feedback explains when and where these different methods can be used.
For organisations building a wider process around collecting, analysing and acting on feedback, our guide to customer feedback management explains how these activities work together.
What website feedback data can you analyse?
Website feedback analytics can combine structured and unstructured data collected at different stages of the online journey.
Website feedback scores
Metrics such as CSAT, CES, NPS and GCR provide a measurable view of satisfaction, effort, loyalty and task completion.
These scores help teams monitor website performance and compare results over time. However, a score alone rarely explains what caused the experience.
Open-text feedback
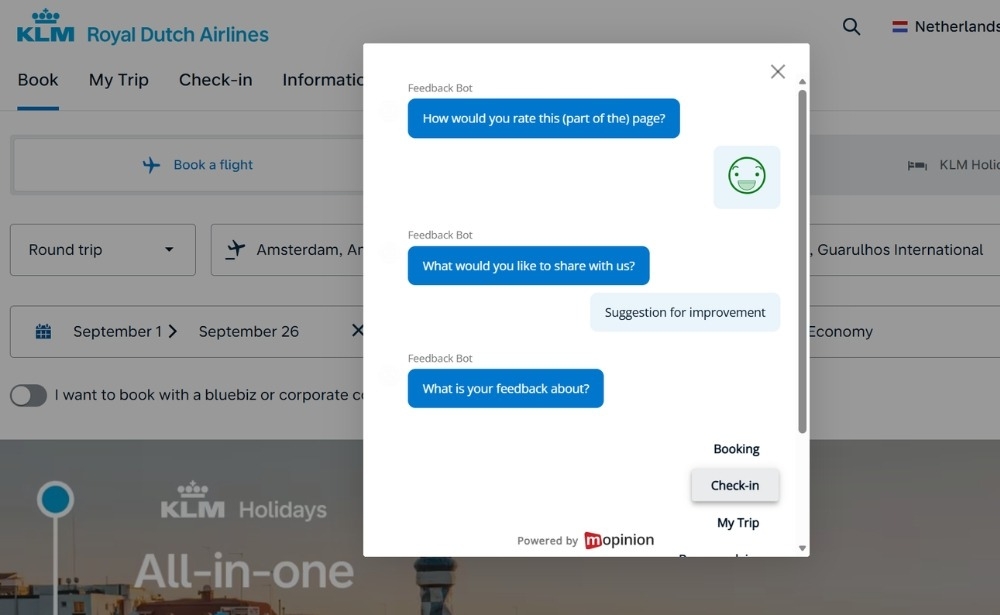
Open questions allow visitors to describe problems, suggestions and positive experiences in their own words.
These comments can reveal issues that predefined answer options may miss, including:
- Confusing navigation
- Missing information
- Technical errors
- Unexpected costs
- Unclear content
- Problems completing a form
- Feature requests
Contextual website data
Connecting responses with contextual data makes the feedback more actionable.
Useful context can include:
- Page URL
- Journey stage
- Device type
- Browser
- Screen size
- Country or language
- New or returning visitor
- Customer segment
- Date and time
A general satisfaction score may show that visitors are unhappy. Contextual data can reveal that the problem mainly affects mobile visitors using a particular browser on the checkout page.
How do you analyse website feedback?
A practical website feedback analytics process can be divided into six steps.
1. Define what you want to understand
Start with a specific website journey, problem or business objective.
For example:
- Why are visitors abandoning checkout?
- Can customers find the information they need?
- Which problems affect the account-registration journey?
- Why has satisfaction declined on a particular page?
- How do visitors experience a newly launched website feature?
Your objective determines which feedback, metrics and visitor segments you should analyse.
2. Collect feedback in the right context
Collect feedback as close as possible to the experience you want to understand.
This could include:
- A feedback button available throughout the website
- An embedded survey on a specific page
- A survey shown after checkout
- An exit-intent form
- A form triggered after a visitor completes or abandons a task
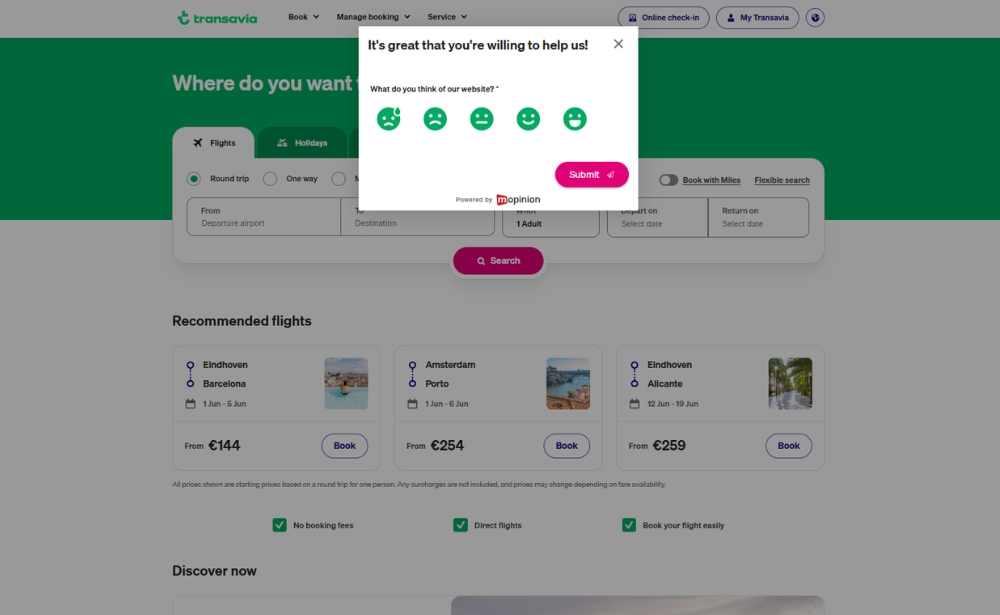
Combine a rating or metric with an open follow-up question. The score provides something measurable, while the comment explains why the visitor selected it.
Mopinion’s website feedback templates include examples for measuring website satisfaction, customer effort, goal completion and other digital experiences.
3. Prepare the feedback data
Bring relevant scores, comments and contextual information together. Remove duplicate, test, spam or irrelevant responses before beginning the analysis.
Cleaning the data does not mean removing criticism. It means ensuring that the dataset is relevant and reliable.
4. Segment and compare the responses
Overall averages can hide important differences. Compare website feedback according to factors such as:
- Page or journey stage
- Mobile or desktop device
- Browser or operating system
- Country or language
- New or returning visitor
- Customer segment
- Feedback score
- Time period
For example, an overall satisfaction score may appear stable while mobile visitors are reporting a growing checkout problem.
5. Identify patterns and root causes
Look for recurring themes, changes in scores and shifts in sentiment. Then examine the comments connected to the most important results.
A declining score indicates that something has changed, but it does not explain why. Open-text responses may reveal that the decline started after a website update, affects a particular browser or relates to one specific stage of the journey.
6. Prioritise and measure improvements
Evaluate each finding according to its frequency, severity, business impact and feasibility.
Once an improvement has been implemented, continue collecting feedback and compare the results. This shows whether the action solved the original problem or whether further investigation is needed.
Which feedback analytics methods can you use?
The right combination of methods depends on the type and volume of website feedback you collect.
Descriptive and trend analysis
Descriptive analysis provides an overview of scores, response volumes and feedback categories. Trend analysis shows how these results change over time.
Together, they can reveal:
- A sudden decline in website satisfaction
- A recurring seasonal issue
- An increase in complaints about a particular page
- The effect of a website update
- Whether an improvement delivered the expected result
A trend shows what is changing. To understand why, teams need to examine the comments and context connected to it.
Segmentation
Segmentation divides feedback into relevant groups so teams can compare their experiences.
You might discover that:
- Mobile visitors report more errors than desktop users
- New customers find registration more difficult
- One country reports lower website satisfaction
- A problem affects a particular browser
- Visitors abandoning checkout repeatedly mention the same issue
These comparisons reveal where an issue is concentrated and which visitors are most affected.
Thematic analysis
Thematic analysis groups open-text feedback according to recurring subjects, such as navigation, payment, delivery, pricing or login problems.
Categories can be created manually, applied automatically or suggested using AI. They provide more context than simple keyword counts. The word “checkout”, for example, does not reveal whether visitors found the checkout quick, confusing or unusable.
Sentiment analysis
Sentiment analysis assesses whether written feedback expresses a positive, negative or neutral attitude.
As IBM explains in its overview of sentiment analysis, the method analyses volumes of text to identify the sentiment being expressed. When combined with themes, it helps teams understand not only what visitors discuss, but also how they feel about it.
For example, “delivery” may be one of the most common topics in your feedback. Sentiment analysis can distinguish praise for fast delivery from complaints about delays.
Automated results should still be reviewed in context, as sarcasm, mixed emotions and specialised language can affect their accuracy.
AI-assisted feedback analysis
AI can help teams analyse large volumes of open-text website feedback by:
- Summarising responses
- Detecting recurring themes
- Categorising comments
- Identifying sentiment
- Highlighting emerging issues
This reduces repetitive manual work, but it does not remove the need for human judgement. Teams still need to validate important findings, understand their context and determine what action to take.
Our guide to AI customer feedback analysis explains these methods in more detail.
How do you turn website feedback into action?
A dashboard does not improve a website by itself. Teams need to decide which findings matter, who owns the next step and how success will be measured.
Start by evaluating each issue according to:
- Frequency: How often does the issue appear?
- Severity: How strongly does it affect the visitor?
- Business impact: Could it affect conversion, satisfaction or retention?
- Feasibility: Can the organisation realistically address it?
The most frequently mentioned issue is not always the most urgent. A technical error that prevents a smaller group of visitors from completing a purchase may require faster action than a minor inconvenience mentioned more often.
The selected insight should then be shared with the team responsible for that part of the website. UX teams may need feedback about confusing navigation, content teams may need comments about unclear information and developers may need reports of technical errors.
Each action should have an owner, a timeline and a way to measure success. After the change is implemented, compare the relevant scores, themes and comments to determine whether the website experience improved.
This creates a continuous website feedback process:
Collect → analyse → prioritise → act → measure
What should website feedback analytics software include?
The right software depends on your website, feedback volume, team structure and reporting requirements.
Important capabilities include:
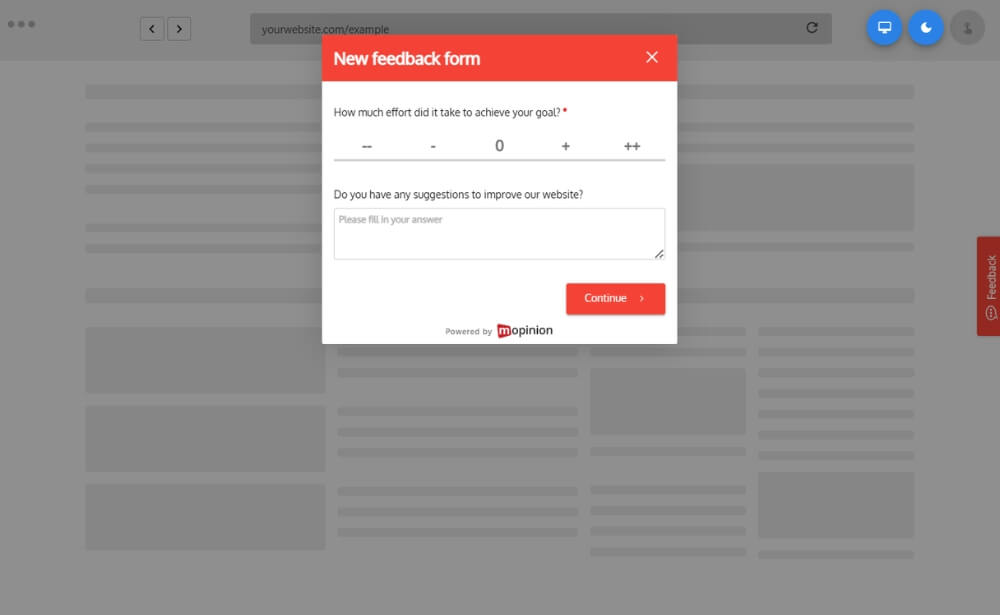
- Flexible feedback collection: Collect feedback through buttons, embedded forms, triggered surveys and exit-intent forms.
- Quantitative and qualitative analysis: Connect website scores with the comments behind them.
- Contextual data: Combine feedback with information such as page, browser, device and customer segment.
- Customisable dashboards: Monitor the metrics and website journeys relevant to each team.
- Filtering and segmentation: Compare responses by page, device, score, topic or visitor group.
- Trend reporting: Track changes and evaluate the impact of website improvements.
- Text and sentiment analysis: Organise open comments and identify recurring themes.
- AI-supported summaries: Understand large volumes of website feedback more efficiently.
- Alerts and workflows: Route urgent or relevant responses to the right team.
- Integrations: Connect feedback with analytics, project management and customer service tools.
- Data governance: Control access, storage, retention and the handling of personal information.
Mopinion, part of Netigate, helps digital teams collect, analyse and act on website feedback. Teams can build customisable feedback forms, target specific website visitors and analyse responses using dashboards, segmentation, categorisation, alerts and AI-assisted analysis.
Explore Mopinion’s website feedback solution to see how these elements work together.
Turn website feedback into continuous improvement
Website feedback analytics helps organisations move beyond individual scores and comments to understand the wider website experience.
By combining quantitative results, qualitative feedback and contextual data, teams can identify important patterns, investigate their causes and make better-informed decisions.
The process should not end when an insight appears on a dashboard. Its real value comes from prioritising the right issue, assigning responsibility and measuring whether the resulting action improved the experience.
Want to see how it works? Start a free Mopinion trial.
Frequently Asked Questions
Website feedback analytics is the process of organising and interpreting feedback collected from website visitors. It helps teams identify patterns, understand visitor experiences and decide which website improvements to prioritise.
Web analytics measures visitor behaviour such as page views, clicks, conversions and abandonment. Website feedback captures what visitors say and how they evaluate an experience. Web analytics shows what visitors do, while website feedback helps explain why.
Teams can analyse quantitative scores, open-text comments and contextual information such as the page, device, browser, customer segment and journey stage connected to each response.
Start by defining a specific objective and collecting feedback in the right context. Then prepare and segment the data, identify recurring patterns and investigate the comments behind important results. Prioritise actions according to their frequency, severity and business impact.
AI can summarise open-text comments, identify recurring themes, categorise responses, detect sentiment and highlight emerging issues. Human review remains important for validating the results, interpreting their context and deciding what action to take.
Ready to see Mopinion in action?
Want to learn more about Mopinion’s all-in-1 user feedback platform? Don’t be shy and take our software for a spin! Do you prefer it a bit more personal? Just book a demo. One of our feedback pro’s will guide you through the software and answer any questions you may have.