Making complex data simple, Mopinion allows you to break down vast amounts of feedback data. This helps you gain actionable insights to help boost your strategies. Following the recent release of access groups, our advanced user management system, unlimited dashboards allows you and your team to create multiple dashboards in a single report. Giving you more power and flexibility over your feedback data and how you visualise it. Now various teams, departments and colleagues can all create their own dashboards to analyse feedback data within Mopinion.
Empower your team to make data-driven decisions
For enterprise businesses or larger organisations, feedback is an effective tool that can benefit virtually all stakeholders and departments, for various reasons. So, in order to allow different roles and teams to analyse feedback and visualise it accordingly, we’ve introduced unlimited dashboards. By creating multiple dashboards you can:
- Measure and track different goals and aspects of your business in a more organised and efficient way.
- Ensure you only see the data relevant to you and your goals.
- Empower your team to make data-driven decisions faster and more accurately.
- Improve you and your team’s overall productivity and performance.
Imagine this.
You’re busy working away within the Mopinion platform. Your goal is to evaluate and measure your recent product releases’ success.
Naturally, you’ll set up a dashboard with charts to monitor the user feedback post-release.
Within Mopinion, you can structure and divide your work into different reports. Previously, you’d have to switch between reports if you wanted to have more than one dashboard. This made data analysis a little tricky.
Things get even more complicated when Mike from marketing also wants to analyse and visualise feedback insights from the same report. With just one dashboard, Mike may need to adjust your charts and dashboard for his analysis. So, to save you a lot of time and energy, we’ve opened up the platform with unlimited dashboards.
Unlimited dashboards empowers you (and Mike) to create as many dashboards as you need in order to effectively track different aspects of your business.

Tip: invite your colleagues and teammates to set up and name their own personal dashboards to get started.
With unlimited dashboards, you have more control over your feedback data and how you visualise it. Whatever your goal is, whether it’s analysing your recent email campaign or comparing feedback from different regions, now you can make specific dashboards for these different goals.
Unlimited dashboards, limitless capabilities
Different teams can often use the same data to analyse and drive decision-making, but they measure it to draw different conclusions. For example, CX professionals and product teams can draw conclusions from the same feedback form data, but will need separate dashboards to monitor their different KPIs.
Members of the CX team may focus on understanding customer preferences and satisfaction. Key feedback form metrics for CX teams would be CSAT, NPS and CES. They’ll then leverage this data to identify trends in behaviour in order to make more informed decisions about the customer experience.

On the other hand, your product team can use the same feedback data, but will focus on measuring these insights to gauge issues, improve product quality, design, and UX. Product teams are interested in feedback data on usability, reliability, and UX design to inform your product and UX roadmap.
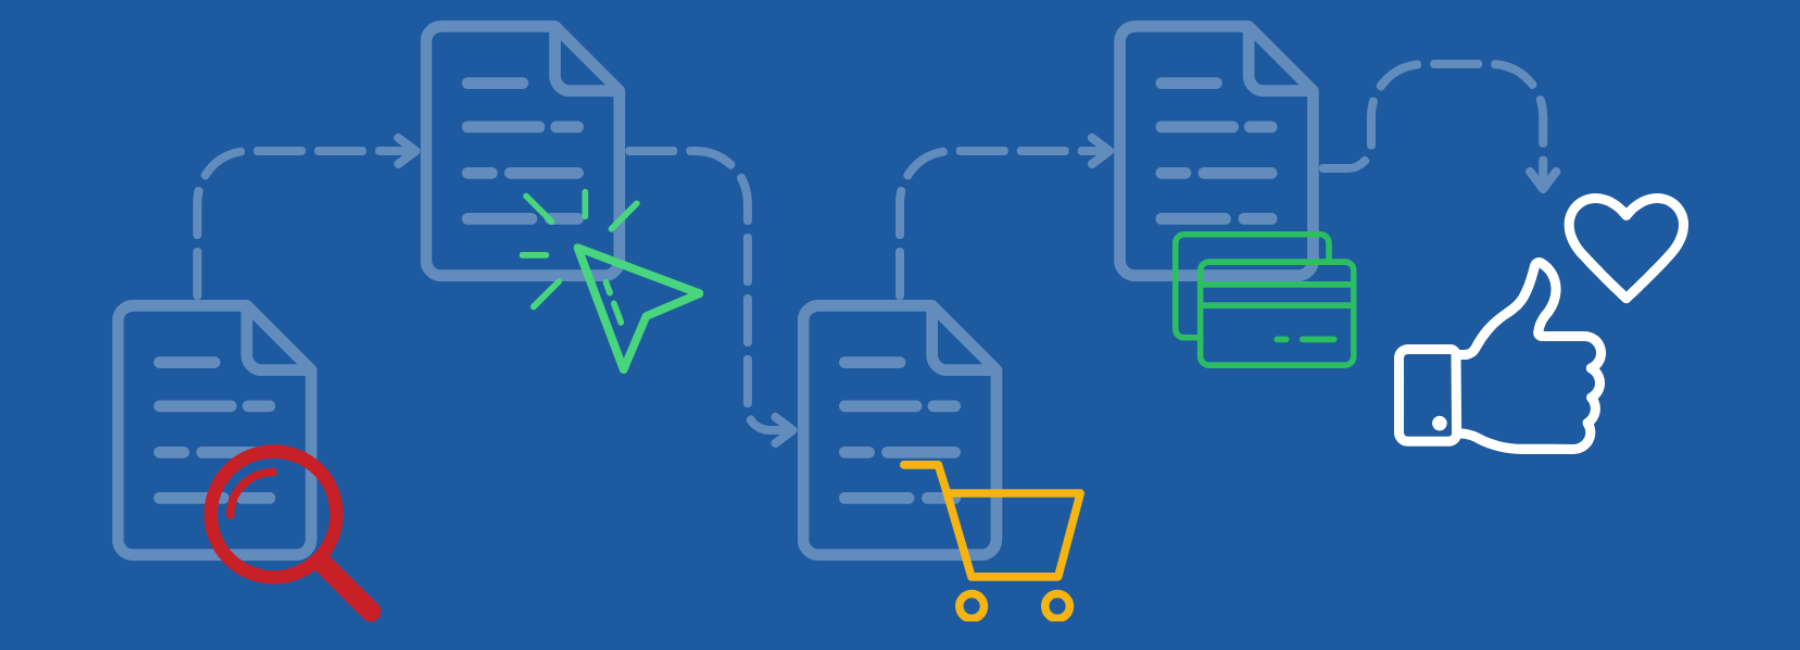
CX teams might analyse the CSAT score over a certain time period, or compare scores to different stages of the customer experience. They might look at feedback after a customer finishes the checkout flow, or drops off. Whilst Product teams will analyse CSAT and compare the data at specific moments, like after a new feature has been released.
Unlimited dashboards allow you to create as many dashboards in one report as you like. Combine and compare data from various feedback forms in a single dashboard, or spread it across several. Having separate dashboards allows each team to see the data that is relevant to their specific goals and KPIs.
Creating individual dashboards provides a more streamlined and focused view of the data, rather than overwhelming you and your team with irrelevant information.
Easily switch and keep track of your data with unlimited dashboards
Inside the platform you’ll notice a new ‘Dashboards’ section. Here’s where all the dashboards for the selected report live.
To keep things running smoothly, you can duplicate charts to other dashboards. This makes it easy to analyse feedback for specific projects, teams, campaigns or goals.
You can also create a personal dashboard, name it as such, and ensure you only see the data that’s relevant to you, your goal or your report.
With this new setup, you can easily switch between dashboards in a single report with the click of a button. This means visualising data is easier than ever.
Other teams or colleagues can duplicate your chart to their dashboard, to save time but also to avoid adjusting your data visualisation. There’s no need to worry about a new user adjusting your well-crafted charts or dashboard, as they can create their own dashboards, copy your charts and adjust as needed.
Stay tuned
Keep your eyes open for more information. We’ve got some handy tips and tricks for making the most of your dashboards on the way.